
Many people open an IUL illustration for the first time and get a shock: the current column grows steadily to age 100, but the guaranteed column drops to zero in their 70s. Is the policy safe? Understanding guaranteed vs non-guaranteed values shows you what the worst case looks like and how to fund the policy to avoid it.
If you are new to illustrations, start with how to read an IUL illustration column by column. This guide goes deep on one question: why a column hits zero.

Guaranteed vs non-guaranteed values: the 3 columns
An IUL illustration usually has at least two sets of columns, and many insurers show three:
| Column set | Assumptions |
|---|---|
| Guaranteed | Minimum contract rate and maximum insurance charges |
| Alternate or midpoint | A rate below the current illustrated rate, current charges |
| Current or illustrated | Illustrated rate and current charges |
Only the guaranteed column is something the insurer commits to in the contract. The other two are examples to help you picture outcomes; they may or may not happen.
The guaranteed rate: the floor on money inside the policy
The guaranteed column uses the lowest rate the contract promises. In one insurer’s sample illustration, this is 1.75% a year for the guaranteed column. Each insurer and product has its own; some use 0% or 1% for index strategies, depending on how they build this column.
Maximum charges: the guaranteed maximum cost of insurance table
The insurer may adjust current cost of insurance rates, but never above the table of guaranteed maximum cost of insurance rates in the contract. Rates are per $1,000 of coverage per month. For example, if the maximum at age 60 is $0.41193 per $1,000 per month, a $200,000 policy has a maximum charge of:
- $200,000 ÷ $1,000 = 200.
- 200 × $0.41193 = $82.39 a month.
- $82.39 × 12 ≈ $989 a year, the ceiling the insurer can charge at that age.
Current rates are usually below this ceiling. The guaranteed column uses the ceiling at every age. See IUL fees explained.
Why does the guaranteed column hit zero?
Picture the policy as a pond: premiums flow in, interest raises the level, and insurance charges drain out every month. Charges rise with age, so the drain gets stronger over time.
- In the current column, interest is higher and charges are lower, so the pond stays full enough to pay charges for life.
- In the guaranteed column, interest is very low and charges are at the ceiling. Once premiums stop, more drains out than comes in, and one year the pond runs dry. That is when the column hits zero and the illustration shows a lapse.
In one insurer’s sample illustration (male age 45, premiums for 20 years), the guaranteed column hits zero in policy year 31, the alternate column in year 38, and the current column lasts for life. This is normal for most IUL illustrations and is not a sign of a bad policy. What matters is that you know the number and have a plan.

Hypothetical example: 3 scenarios, one premium
Using a simplified model for a male age 45 paying $5,000 a year for 20 years. Assumptions: an 8% premium charge, yearly charges starting at $1,200 and rising 4.5% a year with age, and maximum charges at 1.5 times current charges.
- Guaranteed scenario: 1.75% rate, maximum charges. $5,000 × 92% = $4,600 goes in each year, but the first-year charge is already $1,200 × 1.5 = $1,800 and rising. The account value in year 20 is only about $44,500. After premiums stop, the money runs out in year 30, at age 74.
- Alternate scenario: 4.5% rate, current charges. About $92,900 in year 20, and the policy runs out at age 97.
- Current scenario: 6.25% rate, current charges. About $115,500 in year 20, still in force at the end of the model (age 120).
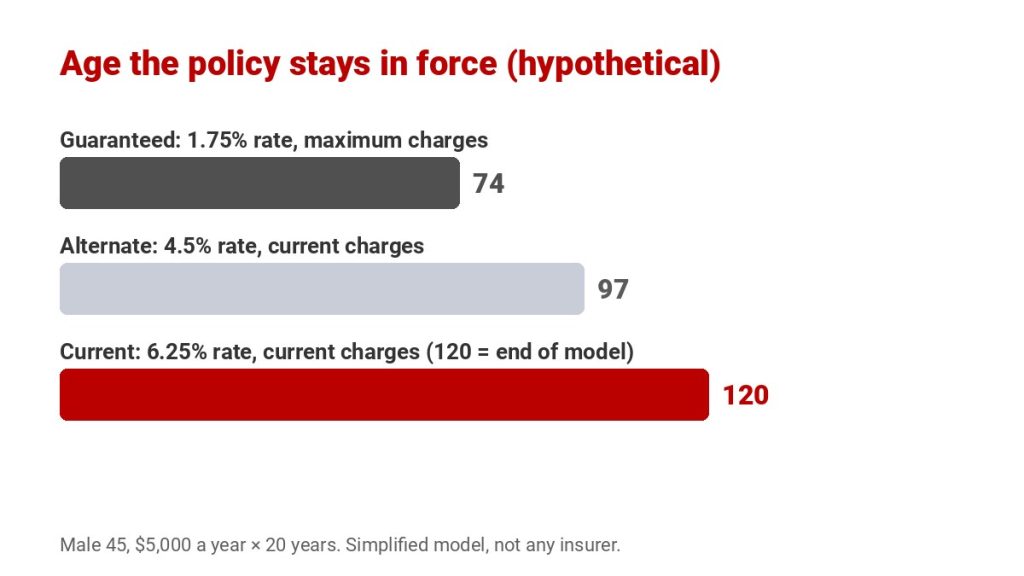
Same policy, same premium, and the outcomes differ by more than 40 years. That is why you should never look only at the current column. This model is heavily simplified; real illustrations are calculated monthly by age, sex, risk class and product.
Calculator: how long does the policy last? (hypothetical model)
The guaranteed column is a stress test, not a forecast
Crediting only the minimum rate for 30 years straight while the insurer raises charges to the ceiling at every age is a very bad scenario. But this stress test tells you two important things:
- What is certain: if everything goes wrong, how long the policy lasts at the premium you pay.
- The risk gap: the wider the gap between the age the guaranteed column hits zero and the age the current column lasts to, the more the policy depends on non-guaranteed rates and charges.
If you need protection you can count on up to a certain age, ask your agent what premium keeps the guaranteed column alive to that age, or consider a policy with more guarantees. See IUL vs whole life.
How to keep your policy from hitting zero

- Fund at or above the illustrated premium in the early years, while insurance charges are low. Paying the minimum for years is the fastest way to underfund a policy.
- Ask for an in-force illustration every year. It uses the policy's real current values, so you see early if results lag.
- Do not over-borrow. Loans plus loan interest drain the pond faster. A lapse with a loan outstanding can trigger a large tax bill.
- Ask about lapse-protection riders (such as overloan protection) if you plan to borrow for retirement, and understand their conditions.
- Compare insurers at the same premium and look at all three columns, not just the best-looking one.
Learning about IUL? See IUL cap rate and participation rate and Thinksmart IUL.
5 questions to ask about guaranteed vs non-guaranteed values
Bring these questions to your next meeting with your agent. Good answers make the trade-offs clear before you sign:
- In what policy year and at what age does the guaranteed column reach zero? Write the answer on the first page of the illustration so you remember it.
- What premium would keep the guaranteed column in force to age 85, 90 or 100? Ask for a second illustration at that premium so you can see the cost of more certainty.
- What rate does the alternate column use, and how far below the current rate is it? A wider gap means the illustration shows a more conservative middle case.
- How have this product's caps and charges changed over the past years? Past changes do not predict the future, but they show how the insurer has managed in-force policies.
- If I want to take loans later, what does the guaranteed column look like with those loans included? Loans can shorten the life of a policy sharply in a bad scenario.
None of these questions has a single right answer. The point is to see the whole range, from the stress test to the illustrated case, and choose a premium you can keep paying even in a tight year.
Frequently asked questions
What is the difference between guaranteed vs non-guaranteed values?
Guaranteed values use the contract minimum rate and maximum insurance charges, and are the only figures the insurer commits to. Non-guaranteed values use the illustrated rate and current charges, and may not happen.
Does a guaranteed column hitting zero mean my policy will lapse?
Not necessarily. It means that if rates stay at the minimum and charges at the maximum for many years, and you pay only the premium shown, the policy would run out of money that year. Extra premium and yearly reviews help avoid it.
Can the insurer raise my cost of insurance?
Yes, the insurer can adjust current rates, but never above the guaranteed maximum cost of insurance table in your contract.
Which illustration column should I trust?
None on its own. The current column shows a good scenario and the guaranteed column shows the worst case. Look at both, plus the alternate column if shown, before choosing a premium.
What is an in-force illustration?
An updated illustration run after the policy is in force, using its real current values. Request one every year to check whether the policy is on track.
Have an illustration and unsure about the guaranteed column?
Thinksmart Insurance reads every column with you, shows the year the guaranteed values hit zero and the premium that keeps you safer, in English or Vietnamese, at no cost. Contact us →








 Thinksmart Insurance